Hilsenhoff Biotic Index
|
||||||||||||||||||||||||||
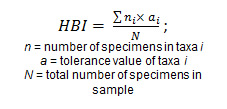
The Hilsenhoff Biotic Index (HBI) estimates the overall tolerance of the community in a sampled area, weighted by the relative abundance of each taxonomic group (family, genus, etc.). Organisms are assigned a tolerance number from 0 to 10 pertaining to that group's known sensitivity to organic pollutants; 0 being most sensitive, 10 being most tolerant.
|
||||||||||||||||||||||||||
 |
||||||||||||||||||||||||||
| An example of how one would use this equation to calculate a biotic index: | ||||||||||||||||||||||||||
|
||||||||||||||||||||||||||
To calculate the Hilsenhoff Biotic Index number (HBI), multiple the tolerance values times the number of specimens (n x a). The sum the products (sigma, ∑). The total is divided by the total number of specimens in all groups (N). In this example: HBI = 43 ÷ 15 = 2.87 |
||||||||||||||||||||||||||
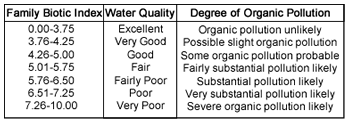
How to Interpret the Results |
||||||||||||||||||||||||||
|
 |
|||||||||||||||||||||||||
|
 |
|||||||||||||||||||||||||
The HBI in the above example was 2.87. What does that say about the health of the stream? |
||||||||||||||||||||||||||